Most B2B companies have invested heavily in data.
They have CRMs, marketing platforms, product analytics, data warehouses, customer platforms and reporting tools. They have dashboards for leadership, reports for marketing and pipelines for sales.
Yet there is a problem that often goes unnoticed until it becomes expensive.
The data can be available without being reliable.
A marketing dashboard may show a sudden drop in qualified leads. A revenue report may display an unexpected change in pipeline. A product team may see customer activity falling sharply.
The immediate reaction is usually to investigate the business.
But sometimes the business did not change.
The data did.
A broken integration, delayed pipeline, unexpected schema change, duplicate records or missing events can quietly affect the information teams depend on to make decisions.
By the time someone discovers the problem, the incorrect data may already have influenced a forecast, campaign, customer conversation or executive decision.
This is where Data Observability becomes increasingly important.
Data observability gives organizations a way to understand the health, reliability and behavior of their data across the modern data stack. Instead of discovering data problems after users complain, teams can identify unusual changes and potential failures earlier.
For B2B companies, this is more than a technical improvement.
Reliable data directly affects revenue forecasting, marketing performance, customer intelligence, product decisions and operational efficiency.
The real question is no longer simply:
“Do we have the data?”
It is:
“Can we trust the data when an important decision depends on it?”
What Is Data Observability?
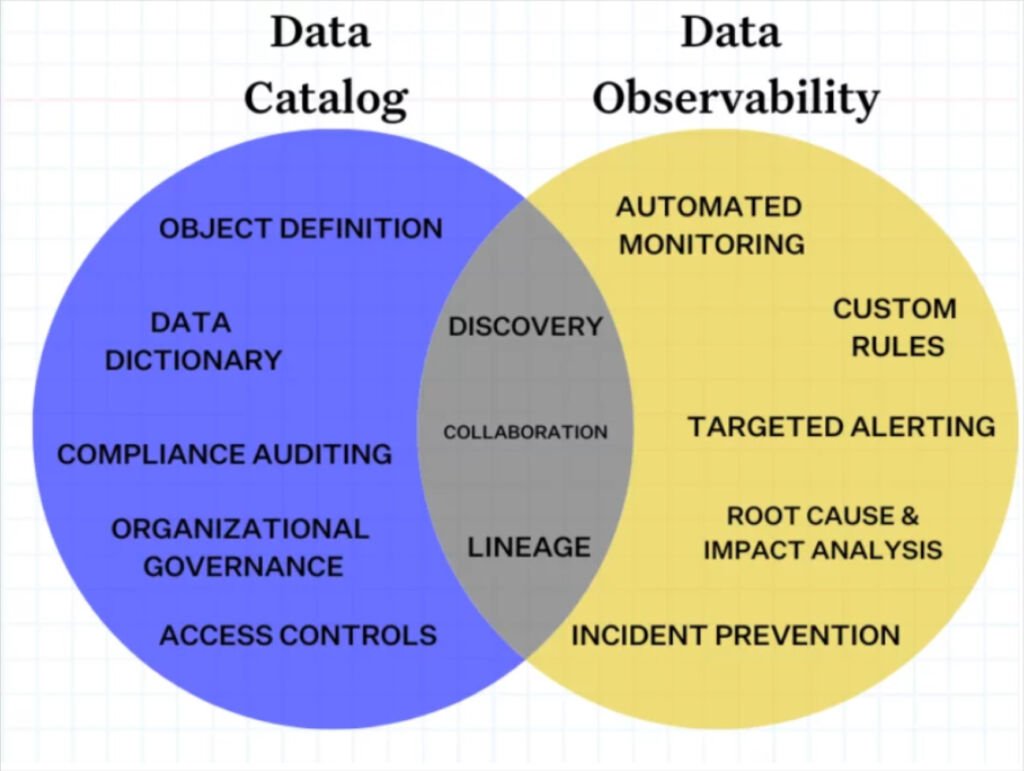
Data observability is the practice of monitoring data systems and datasets to understand whether data is complete, accurate, fresh and behaving as expected.
Traditional data quality checks often focus on individual rules.
For example:
- A customer ID cannot be empty.
- Revenue cannot be negative.
- A date must follow a specific format.
- A table must contain a certain number of records.
These checks are useful.
But modern B2B data environments are more complicated.
A dataset can technically pass a validation rule while still being problematic.
Imagine a SaaS company that normally receives 50,000 product events every day.
One morning, the system receives 48,000 events.
Nothing technically crashes.
The pipeline completes successfully.
But the 4% decline may indicate an issue with a tracking implementation or an integration.
Now imagine the event volume drops by 40%.
The pipeline may still complete successfully unless the organization is monitoring the behavior of the data itself.
This is the core idea behind observability.
Data observability looks for changes in the health and behavior of data, not just whether a process technically completed.
Why Data Observability Matters for B2B Companies
B2B organizations increasingly rely on interconnected data.
Marketing data flows into CRM systems.
CRM data feeds revenue reporting.
Product activity informs customer success.
Customer data influences expansion campaigns.
Financial information shapes forecasts.
When one part of this chain changes unexpectedly, the impact can spread.
A small data issue can become a business issue
Consider a B2B SaaS company using product usage data to identify accounts likely to expand.
A tracking update accidentally stops capturing usage from one segment of customers.
The data pipeline continues running.
The dashboards continue loading.
The customer success team receives its usual reports.
But usage appears lower than it really is.
The company concludes that those accounts are less engaged.
Marketing reduces expansion activity.
Customer success prioritizes other accounts.
Leadership sees lower product adoption.
None of these decisions are based on reality.
The problem started with a relatively small data issue.
The consequences were commercial.
This is why data reliability cannot remain solely a technical concern.
The Growing Complexity of Modern B2B Data Operations
B2B companies have more data sources than ever.
A typical technology company might use:
- CRM platforms
- Marketing automation tools
- Advertising platforms
- Product analytics
- Customer support systems
- Subscription billing
- Data warehouses
- Business intelligence tools
- Customer success platforms
- Website analytics
- Third-party enrichment services
Each system produces data.
Those systems also change.
APIs are updated.
Fields are renamed.
Tracking events are modified.
Vendors change their data structures.
Teams launch new campaigns.
Products add features.
Customers behave differently.
The result is a constantly moving data environment.
A pipeline that worked perfectly six months ago may behave differently today.
That makes continuous visibility into data health increasingly important.
Data Quality and Data Observability Are Not the Same
These concepts are closely related but should not be treated as identical.
Data quality asks whether data meets defined standards.
Data observability asks what is happening to the data and whether its behavior suggests a problem.
Think of it this way.
A data quality test might ask:
Are all customer records assigned a valid customer ID?
Data observability might ask:
Why did the number of customer records suddenly fall by 30% compared with the normal pattern?
Both are valuable.
But observability provides broader context.
It can help teams understand where a problem occurred, when it started, what changed and which downstream systems could be affected.
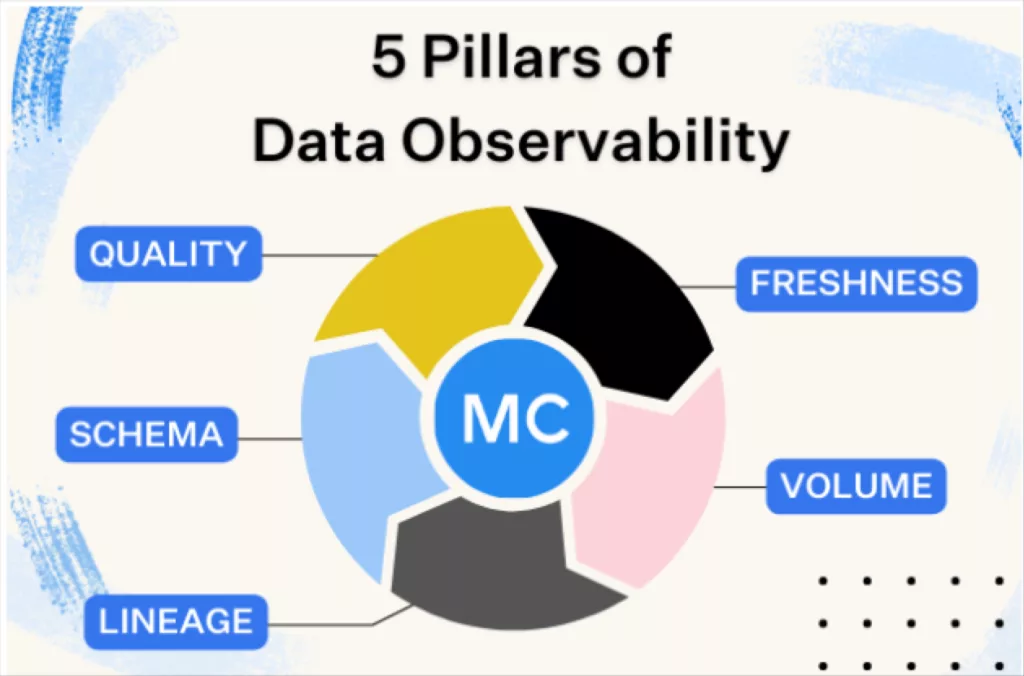
The Five Dimensions of Data Observability
While different organizations may define observability differently, several dimensions are especially useful.
1. Freshness
How recently was the data updated?
Suppose a revenue dashboard is expected to refresh every hour.
If the latest update happened eight hours ago, users need to know before relying on it.
Freshness problems can be particularly dangerous because the dashboard may look perfectly normal while presenting outdated information.
2. Volume
How much data is arriving?
Unexpected changes in volume can reveal broken integrations, missing events or unusual business activity.
For example, if a lead table usually receives between 800 and 1,000 records per day and suddenly receives 150, that deserves investigation.
3. Distribution
What does the data look like?
Suppose 80% of a company’s opportunities usually come from three customer segments.
Suddenly, 95% come from one segment.
That could represent a genuine market shift.
It could also indicate a data mapping problem.
Distribution monitoring helps organizations spot unusual changes in the shape of their data.
4. Schema
Has the structure of the data changed?
A software vendor may rename a field.
An internal team may change an event structure.
A developer may modify the format of a value.
These changes can break downstream processes even when the original system continues functioning normally.
5. Lineage
Where did the data come from and where does it go?
Data lineage helps teams understand relationships between sources, transformations and downstream reports.
If a critical revenue dashboard is wrong, lineage can help answer:
Which source or transformation should we investigate first?
This can dramatically reduce the time required to diagnose problems.
The Business Impact of Poor Data Observability
Poor data observability creates more than technical inconvenience.
It creates uncertainty.
Marketing decisions become less reliable
Marketing teams depend on data to understand campaign performance, audience behavior and pipeline contribution.
If lead or attribution data is incomplete, marketing may invest in the wrong channels.
Sales forecasts become harder to trust
Revenue teams rely on pipeline data to forecast bookings.
If opportunity values, stages or close dates are incorrect, the forecast can become misleading.
Customer success can miss risk signals
Product usage, support activity and customer engagement often inform retention strategies.
If those signals are missing, customer risk may be identified too late.
Executives lose confidence in analytics
Perhaps the most damaging consequence is organizational.
If leaders repeatedly discover that reports contain errors, they stop trusting the data.
Once that happens, people return to spreadsheets, manual checks and personal judgment.
The company may still have an impressive data stack.
But adoption falls because confidence has disappeared.
A Mini Case: The Pipeline That Wasn’t Actually Growing
Consider a fictional B2B technology company preparing for its quarterly board meeting.
The sales dashboard shows pipeline growing by 22%.
The CEO is encouraged.
The marketing team believes recent campaigns are working.
Sales leadership expects a strong quarter.
A data observability system flags an unusual pattern.
The number of new opportunities is normal, but the average opportunity value has increased sharply.
That sounds positive.
Further investigation shows that a CRM field mapping change caused certain deal values to be duplicated during an automated update.
The pipeline did not actually grow by 22%.
The data changed.
Without observability, the issue might have survived until the board meeting.
With observability, the team can investigate the anomaly before it influences a major business decision.
This is the real value of observability.
It does not simply tell you that something is wrong.
It helps you discover that something deserves attention before the consequences become larger.
Data Observability for Marketing Operations
Marketing is an especially important area for data observability because modern B2B marketing depends on multiple connected systems.
Consider a lead journey:
Website → Marketing automation → CRM → Sales qualification → Opportunity → Revenue
A failure anywhere in this chain can distort reporting.
For example, website leads may continue arriving but stop syncing correctly to the CRM.
Marketing sees normal lead volume.
Sales sees fewer new leads.
The teams may spend days debating the reason.
A data observability layer can flag the unexpected change in record flow between systems.
That can turn a cross-functional argument into a technical investigation.
What marketing teams should monitor
Useful signals include:
- Lead volume
- Lead freshness
- CRM sync rates
- Campaign attribution
- Contact enrichment
- Account matching
- MQL to SQL movement
- Opportunity creation
- Conversion rates
- Revenue attribution
The goal is not to monitor every field.
It is to monitor the data that influences important decisions.
Data Observability for Revenue Teams
Revenue organizations have another major use case.
Pipeline data changes constantly.
Deals are created, updated, moved between stages and closed.
A reliable revenue operation needs confidence that these changes are reflected accurately across systems.
Observability can help identify:
- Sudden changes in opportunity volume
- Unexpected changes in average deal size
- Stalled data updates
- Missing opportunity records
- Unusual stage distributions
- Changes in close-date patterns
- Broken CRM integrations
This is particularly useful before forecasting meetings.
Instead of asking:
“Does this number look right?”
Revenue teams can build a stronger process around knowing whether the underlying data is behaving normally.
Data Observability for Customer Success
Customer success teams increasingly use product and engagement data to identify churn risk and expansion opportunities.
That makes data reliability especially important.
Imagine a customer health score suddenly drops for 500 accounts.
There are two possibilities.
Customers are actually using the product less.
Or the product analytics integration has stopped sending events.
Without observability, the business may assume the first explanation.
With observability, the team can check whether the data itself changed.
This distinction can prevent unnecessary customer interventions and help teams focus on genuine risk.
The Role of AI in Data Observability
AI is becoming increasingly relevant to data observability because modern data environments produce large numbers of signals.
The challenge is not simply detecting anomalies.
It is understanding which anomalies matter.
AI can help identify unusual patterns, correlate related changes and summarize potential causes.
For example:
“Lead volume dropped 28% this morning.”
That is useful.
A more helpful system might say:
“Lead volume dropped 28% compared with the normal weekday range. The decline began shortly after a change to the website form integration. CRM records remain normal for existing leads but new submissions are not arriving.”
That moves from detection toward investigation.
AI can also help reduce alert fatigue by prioritizing anomalies based on potential business impact.
This matters because an observability system that produces hundreds of alerts every day can become another source of noise.
Data Observability Is About Trust, Not Just Monitoring
One of the more important strategic insights is that observability should not be measured only by the number of problems detected.
Its deeper value is confidence.
A marketing leader should be able to look at a performance report and have confidence that the data is fresh and behaving normally.
A CFO should be able to review a revenue forecast without wondering whether yesterday’s integration failed.
A CEO should be able to use a dashboard without asking an analyst to manually verify every number.
This creates something difficult to measure but extremely valuable:
organizational trust in data.
When data is trusted, people use it.
When data is not trusted, people work around it.
How to Build a Data Observability Strategy
You do not need to monitor every dataset immediately.
A focused approach is usually better.
Step 1: Identify business-critical data
Start with datasets that influence important decisions.
For example:
- Revenue
- Pipeline
- Customer health
- Marketing attribution
- Product usage
- Financial reporting
Do not begin with every table in the warehouse.
Step 2: Map the data journey
Understand where important data originates and where it goes.
For a revenue report, that could look like:
CRM → Data warehouse → Transformation → BI dashboard → Executive reporting
This gives teams visibility into dependencies.
Step 3: Establish normal behavior
Observability requires context.
A 10% change may be normal for one dataset and highly unusual for another.
Establish expected ranges for:
- Volume
- Freshness
- Distribution
- Schema
- Update frequency
Historical patterns can be particularly useful.
Step 4: Prioritize meaningful alerts
Not every anomaly requires an immediate notification.
A small change in a low-impact dataset may not matter.
A small change in a critical revenue dataset might matter enormously.
Alerts should reflect business importance.
Step 5: Define ownership
When an issue appears, someone needs to know what happens next.
Define:
- Who receives the alert?
- Who investigates?
- Who owns the source system?
- Who communicates business impact?
- Who confirms the issue is resolved?
Observability without ownership simply creates visibility without action.
Common Data Observability Mistakes
Mistake 1: Monitoring everything
More monitoring is not automatically better.
Too many alerts can cause teams to ignore important ones.
Focus on high-value data.
Mistake 2: Treating pipelines as the only problem
A pipeline can succeed while producing bad data.
Observability should monitor the data itself, not only whether jobs completed.
Mistake 3: Ignoring business context
A technical anomaly does not automatically mean a business problem.
A sudden increase in leads could be a broken integration or a successful campaign.
Context matters.
Mistake 4: Failing to define ownership
An alert without an owner is unlikely to produce a fast response.
Every critical data domain should have clear accountability.
Mistake 5: Measuring success by alert volume
The goal is not to discover more problems.
The goal is to reduce the time and business impact associated with data problems.
Better metrics include:
- Time to detect
- Time to investigate
- Time to resolve
- Number of downstream users affected
- Number of decisions affected
- Recurrence of similar issues
A Practical Data Observability Checklist
Before implementing a data observability initiative, ask:
- Which datasets influence our most important decisions?
- Do we know where those datasets originate?
- Do we know which reports and systems depend on them?
- Can we detect stale data?
- Can we identify unexpected volume changes?
- Can we detect schema changes?
- Can we identify unusual data distributions?
- Do we understand critical data lineage?
- Are alerts prioritized by business impact?
- Does every critical data issue have an owner?
- Can we measure how quickly issues are detected and resolved?
- Do business users know when a dataset should not be trusted?
If several answers are unclear, there is likely an opportunity to strengthen the organization’s data operations.
Data Observability Should Become Part of Data Strategy
For years, businesses have focused on collecting more data.
Then they focused on centralizing it.
Then they focused on analyzing it.
The next challenge is ensuring that the data remains dependable as the environment becomes more complex.
That makes observability an important part of modern data strategy.
It creates a layer between data infrastructure and business decisions.
Without it, organizations can have a sophisticated data stack but limited confidence in what that stack produces.
With it, teams can identify issues earlier, investigate them faster and communicate their impact more clearly.
The Missing Layer Is Not Another Dashboard
There is a temptation to solve every data problem with another dashboard.
But a dashboard tells you what the data says.
It does not necessarily tell you whether the data deserves to be trusted.
That distinction is becoming increasingly important.
As B2B companies automate more processes and rely more heavily on data-driven decisions, the cost of unreliable data increases.
A wrong number in a presentation is inconvenient.
A wrong number in a revenue forecast can change hiring plans.
A wrong attribution report can redirect marketing spend.
A wrong customer health signal can influence retention strategy.
A wrong product usage report can change product priorities.
The data layer is now deeply connected to business outcomes.
That means its reliability deserves the same attention as application performance, security and financial controls.
Final Thoughts
Data observability is not about creating a perfect data environment.
Modern data systems will always change.
Integrations will fail.
Schemas will evolve.
Tracking implementations will be updated.
Unexpected patterns will appear.
The objective is to make those changes visible before they become business problems.
For B2B organizations, that means moving from a reactive model of discovering bad data after someone notices it to a proactive model of understanding data health continuously.
The most mature data teams will not simply ask whether their pipelines are running.
They will ask whether their data is behaving as expected, whether important changes are explainable and whether decision-makers can trust what they are seeing.
That is the real role of Data Observability.
It is not another layer of monitoring for the sake of monitoring.
It is a foundation for trustworthy data operations and better business decisions.
As organizations become increasingly dependent on data, knowing when not to trust a number may become just as valuable as knowing what the number says.